Read the chart in four steps
- Check the symbol, scale, and timeframe. The horizontal axis shows time and the vertical axis shows price. A daily candle summarizes one trading day; a 15-minute candle summarizes a shorter interval. The visible date range and the interval of each bar are different settings.
- Read price bars or candles. Each candle records the open, high, low, and close for its interval. The body spans the open and close; the wicks extend to the high and low. Check the chart's color convention to distinguish a close above the open from a close below it.
- Compare volume with price. Volume shows how many shares traded during an interval. Compare it with nearby intervals on the same timeframe. A large price move and a change in volume describe what happened; they do not establish what happens next.
- Add an indicator for a defined question. A moving average summarizes recent prices. Choose its period and interval deliberately, and compare its value with the underlying bars. Indicators transform past or current data; they are not independent predictions.
For example, a hypothetical daily candle with an open of $100, high of $104, low of $99, and close of $102 has a body from $100 to $102 and wicks reaching $99 and $104. It closed above its open, but that observation alone does not explain the move or predict the next session.
Keep a research note with the symbol, date range, interval, and observation you want to test. Use paper trading to practice a defined workflow, and the indicator guide to understand supported inputs.
Markets and charts
Use the dashboard and symbol tools to inspect current market data, compare price history, and move into a watch list, screener, trade, or automation workflow.
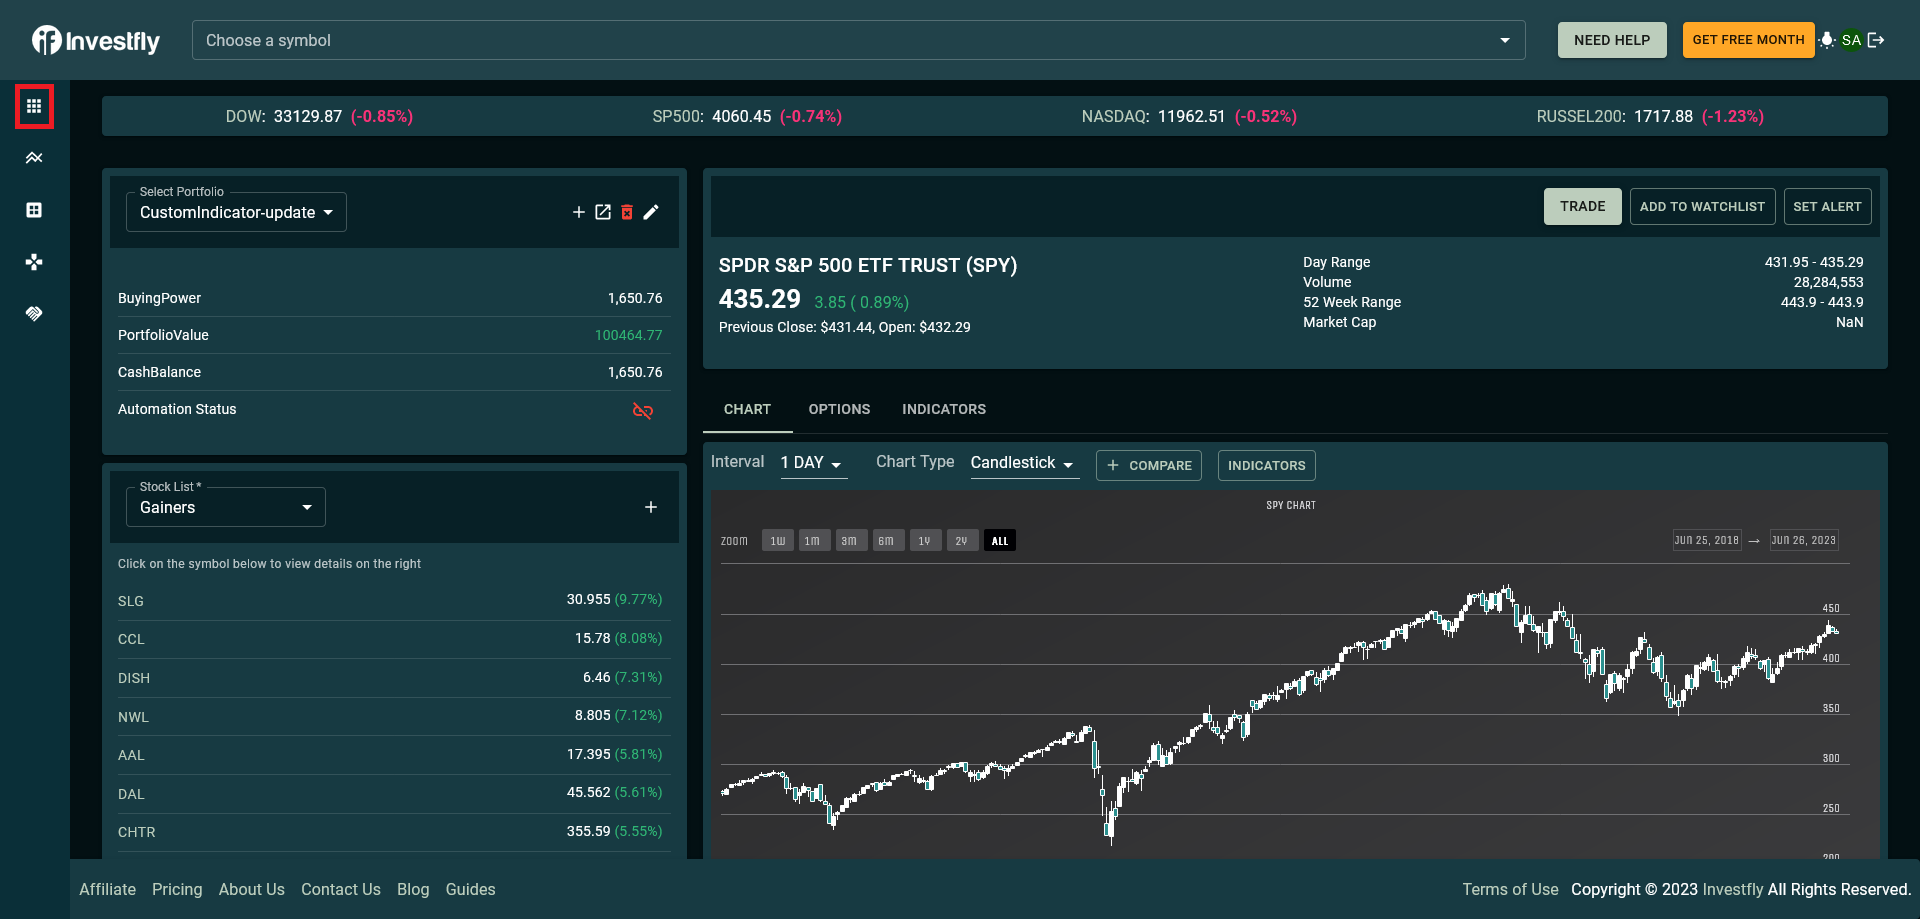
Dashboard market pulse
The Trading Dashboard rotates through broad market and asset snapshots alongside your selected portfolio, saved research lists, strategies, and Market Automations. Values are informational snapshots and can update at different times depending on the market and provider.
Find a symbol
Use the global symbol chooser to search supported securities and open the relevant detail page. Available sections can include quote summary, chart, company or instrument information, financial data, news, options, Manual Trade, and Add to Watch List.
The displayed sections vary by asset and available data; an equity detail page and a futures or crypto view do not have identical fields.
Use the chart
- Choose a symbol and time interval.
- Switch between supported line and candlestick views.
- Zoom or change the visible historical range.
- Compare additional symbols where the chart offers comparison.
- Add, configure, edit, or remove supported standard and custom indicators.
Chart configuration is kept for the current browser session. Indicator values reflect their selected interval and input parameters.
Move from research to action
Add symbols you want to follow to a Watch List, evaluate a wider universe with a Screener, place a user-directed Manual Trade, or create a Market Automation for a saved false-to-true condition.