Price and volume
Filter on supported quote fields such as last price and volume. Select stocks or ETFs, and narrow stock research by sector.
Find the stocks and ETFs that match your research question. Combine price, volume, fundamentals, and technical indicators, then save the screen and review matching securities in one place.
A stock screener filters a universe by conditions you define. Investfly brings market data, company fundamentals, and indicator calculations into the same visual expression builder.
Filter on supported quote fields such as last price and volume. Select stocks or ETFs, and narrow stock research by sector.
Use stock fields such as market capitalization, P/E, dividend yield, revenue growth, and margins to express valuation or business criteria.
Build conditions with supported moving averages, RSI, MACD, and other indicators. Choose the available bar interval and combine conditions with AND/OR logic.
Use compatible Python custom indicators when a built-in measure does not express your idea. The visual builder remains available without writing code.
Explore custom indicatorsThese examples illustrate different research tasks. Thresholds are yours to choose; a match is not a recommendation or a prediction.
Compare daily closing price with a 20-period simple moving average, then add a quote-volume threshold. Review the matching charts before deciding which symbols deserve more study.
Follow the worked screener guideCombine a market-cap range with a positive P/E below your chosen ceiling, or add a minimum dividend yield. Inspect missing values and financial reporting dates before comparing companies.
Screen for daily RSI(14) below a threshold such as 30 and examine the surrounding price action. An indicator reading describes a condition; it does not guarantee a reversal.
Keep the criteria alongside the results. Compare values, inspect individual charts, and decide what to research next.
Follow a symbol into its chart and detail view to put a matching condition in price and volume context.
Compare supported indicator values in the result grid. Use desktop grid filters and export for further review.
Save a definition to rerun it. Clone a screen when you want to compare a different condition while keeping the original research question.
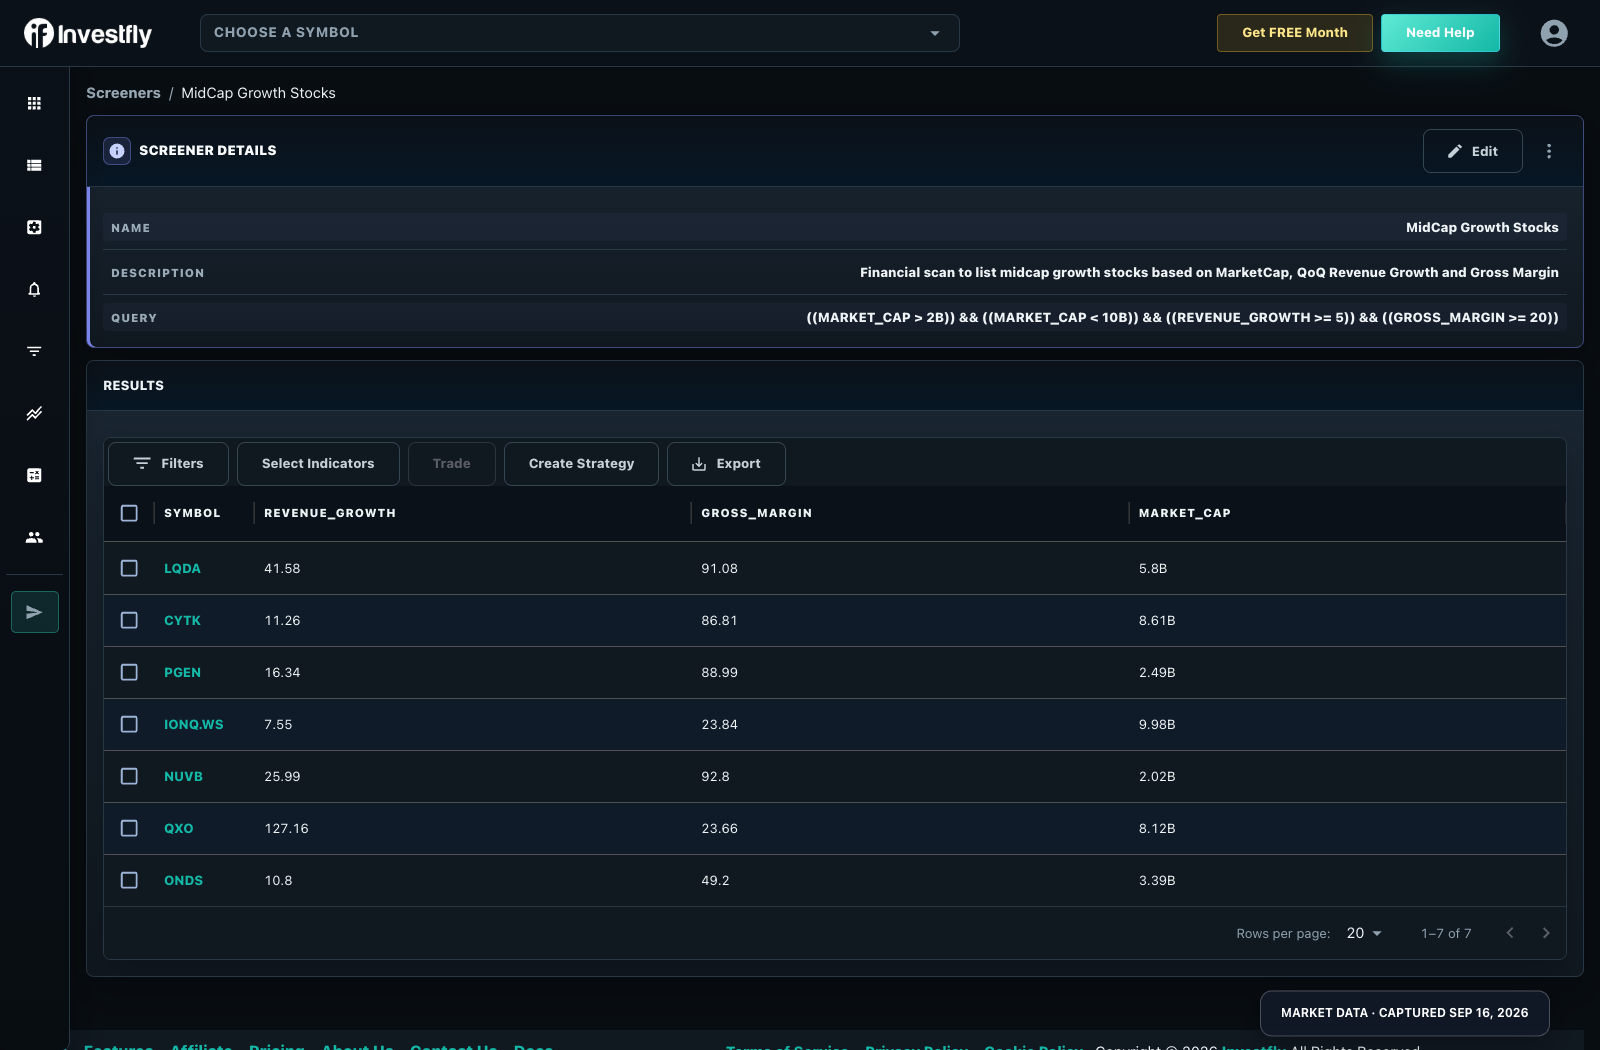
Product screenshot captured September 16, 2026 from a fictional local demo with simulated data, not a current scan or a list of stock recommendations.
Start from a screener template or a blank definition. Select your market and sector where applicable, then combine quote, financial, and indicator conditions.
Run the screen and inspect the matches. Check the inputs, timestamps, and chart context rather than treating a matching row as an instruction to trade.
Save the definition, rerun it during your next review, or build a strategy from the screener where the product offers that action. Review entry, sizing, and exit settings separately.
Explore stock strategiesA screen evaluates the available data when it runs. Saved results can refresh while the results view is open, but a screener does not send condition notifications by itself.
Use a separate Market Automation when you want ongoing condition monitoring and notifications. A full trading strategy adds explicit entries, sizing, exits, and position management.
Explore condition monitoringA stock screener filters a set of stocks using conditions such as price, volume, company fundamentals, or technical indicators. Investfly returns the securities that satisfy your definition using the available data at the time of the run.
Yes. Investfly's free Standard plan includes one saved stock screener. Paid plans provide higher resource limits. Check the Pricing page for current plan details.
Yes. For stocks, combine supported financial fields such as market cap, P/E, or dividend yield with quote and indicator conditions. Fundamental fields are not interchangeable with ETF data, and update timing can differ between sources.
You can define daily conditions for swing research or use supported shorter indicator intervals for intraday research. Data coverage, history, and update frequency vary. The screener is not a high-frequency scanner and does not promise universal real-time latency.
No. Create supported filters through the visual builder or start from a template. Python custom indicators are an optional way to extend compatible calculations.
The stock screener guide walks through setup, a daily-trend example, result interpretation, and saved-screen management. It also links to the Expression Builder and indicator documentation.
Start with supported stocks and ETFs, define the conditions you want to study, and turn a broad market into a focused research shortlist.
Screening results are data matches, not investment recommendations. Available fields, symbols, and intervals depend on current product and data support.