How to create a stock screener
A screener answers a point-in-time research question: which securities in this universe satisfy these conditions now?
Screeners do not keep false/true state and do not schedule notifications. When you need a condition to be monitored for a new match, use a Market Automation.
Configure and run your stock screener
- Open Screeners and choose a template or create a new screener.
- Select an equity/ETF universe such as a standard list, sector, or custom symbols.
- Build the criteria from supported price, quote, financial, standard-indicator, or custom-indicator inputs.
- Run the screener and inspect the matching rows. Save it if you want to reuse the definition.
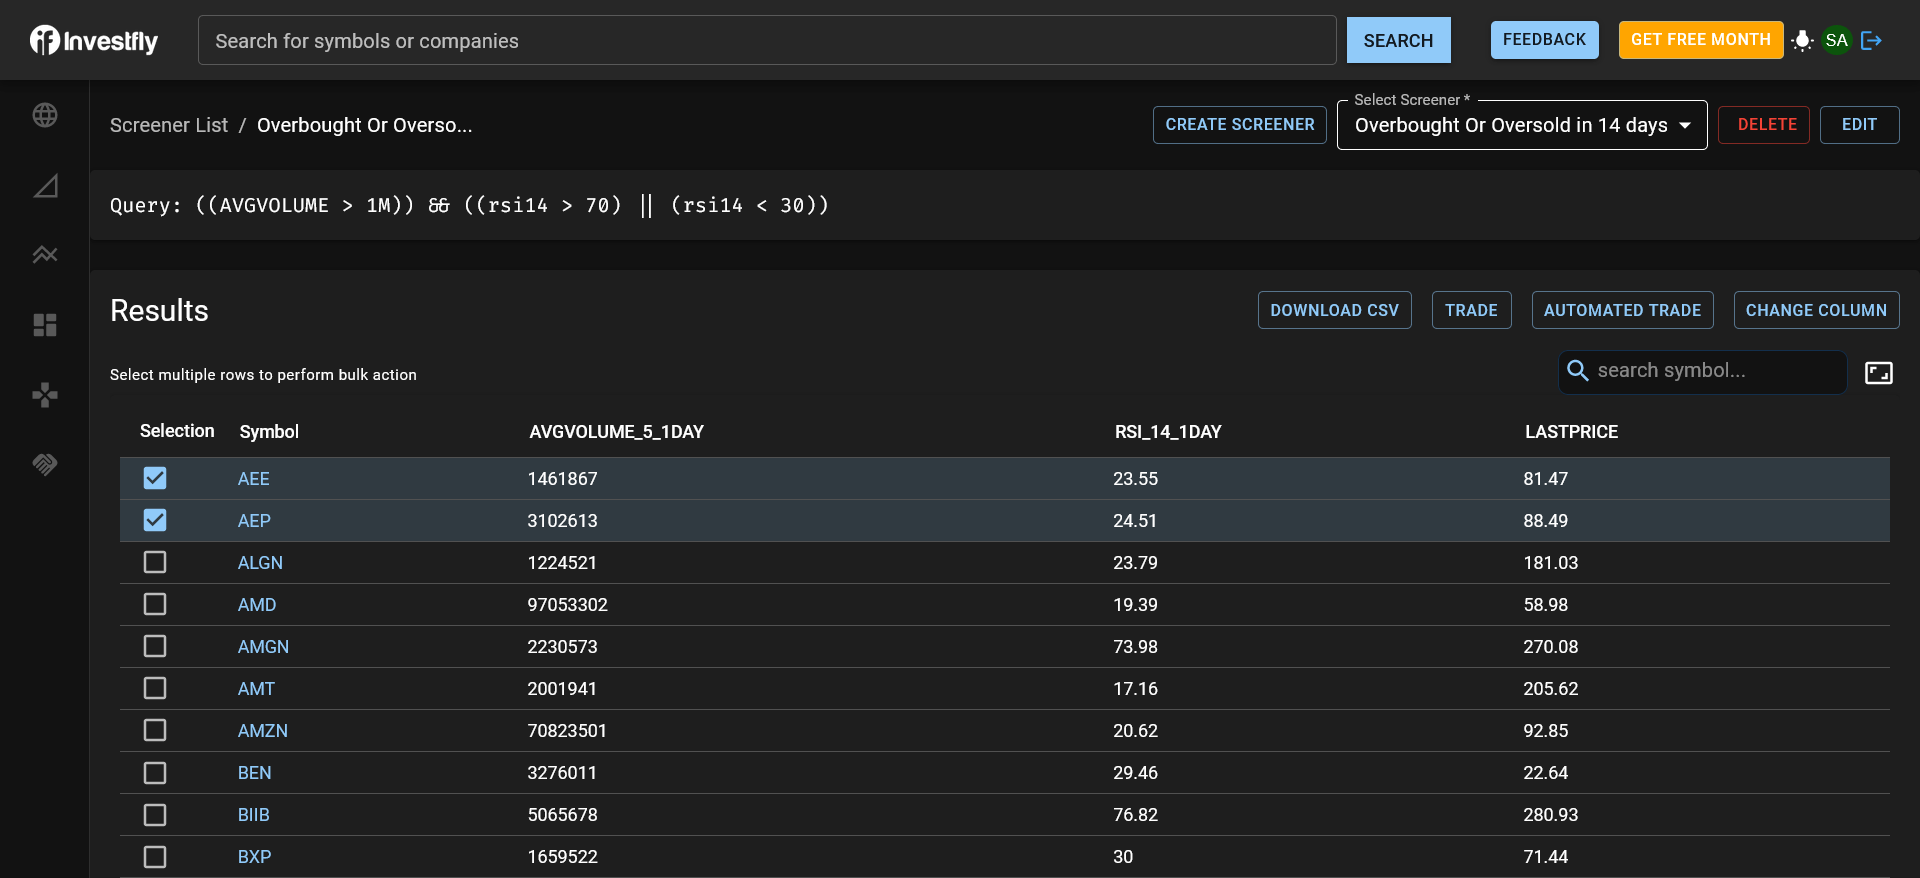
Example: build a swing-trading research shortlist
A stock screener for swing trading can narrow a daily research universe before you inspect individual charts. This example shows how to express a research question; it is not a recommended trading strategy.
- Choose a stock or ETF universe you want to study.
- Use daily price bars for the indicator inputs. For example, compare the closing price with a 20-period simple moving average to identify symbols above their recent average.
- Add a supported volume condition with a threshold you choose, and combine it with the price condition using AND. Keep the interval consistent across inputs.
- Run the scan and inspect each matching chart. Compare price history and volume, and record why a symbol belongs on your research shortlist.
- Add selected symbols to a stock watchlist. Save the screener and rerun the same definition when you next review the market.
The 20-period average is an illustrative input, not an optimized setting. A match is a current data condition, not an entry signal or a forecast. See technical indicators and Expression Builder to understand the available inputs and logic.
Investfly's stock screener software keeps the saved criteria separate from a trading strategy. Use Market Automation when you need ongoing condition monitoring, or test an explicit entry, sizing, and exit plan with the stock trading bot workflow.
Understand the results
A result means the available data made the expression true during that run. It does not predict a price move and is not an investment recommendation. Inputs can update at different frequencies, so review both the condition and the data interval.
Saved results can refresh while the results view is open. Use filters to narrow the grid and add supported indicator columns to compare the current matches.
Work with matching securities
- Open a symbol's chart or detail view.
- Add selected symbols to a watch list.
- Add indicator columns to the results.
- Export the available grid data from the desktop workflow.
- Select rows and open the multi-security trade workflow.
- Use a screener definition as the starting universe for a strategy where the product offers that action.
Manage saved screeners
From the Screener list you can run, edit, clone, or delete a saved definition, subject to your plan's resource limit. Cloning is useful when two research questions share a universe but need different conditions.
See Expression Builder for AND/OR logic, Indicators for indicator inputs, or the stock trading bot platform for the complete stock research and automation workflow.